

Why did my Instagram reach drop? Split the number before you blame the algorithm


The Junibloom team
Building the growth OS for growing creators
Your reach fell off a cliff, you changed nothing, and now you are three search results deep in "Instagram algorithm update" threads written by people as confused as you.
Start with the least dramatic answer: the number may not have finished arriving. Meta's own Instagram documentation says data used to calculate metrics can be delayed up to 48 hours. After that, "reach" is one number hiding two different audiences, and they fall for different reasons. Split it before you rewrite anything.
The short version:
- Wait two days before you diagnose. Meta states that metric data can lag up to 48 hours, so a fresh number is not a finished number.
- Reach is two audiences in one stat: followers who saw the post, and non-followers who discovered it. Look at which half actually moved.
- Follower reach falls with timing, cadence and format fatigue. Discovery reach falls when a post does not earn the early engagement that pushes it wider.
- The most common cause is the least interesting one: you posted less, or one viral post is distorting the average you are comparing against.
- You cannot run any of these comparisons without history, and Instagram keeps only 90 days of your account-level numbers.
Check the clock before you check the algorithm ⏱
This is the step almost every guide skips, and it costs people a week of panic.
Meta's Instagram Platform documentation states, in the limitations on its insights endpoints, that "Data used to calculate metrics can be delayed up to 48 hours." That is the platform describing its own pipeline, not a theory about ranking.
We watched it happen on our own account. A post read 68 in one session and 156 two days later, with nothing changed in between except time. The first number was not wrong exactly. It was incomplete, and it looked exactly like a collapse.
So the first rule of diagnosing a reach drop is to stop diagnosing it for two days. If you are comparing yesterday against a settled week from last month, you are comparing a partial number against a complete one, and the gap you are panicking about is partly just the delay.
Two cautions, so this does not become its own folklore. Meta says "up to" 48 hours, which is a ceiling and not a schedule. And this explains a fresh number reading low, not a genuine month-over-month decline. If the drop is still there after two days, it is real, and the rest of this post is how you find it.
Split the number
Open any recent post's insights and look at reach by followers vs non-followers. Now do the same for posts from your stronger weeks. You are looking for which side moved:
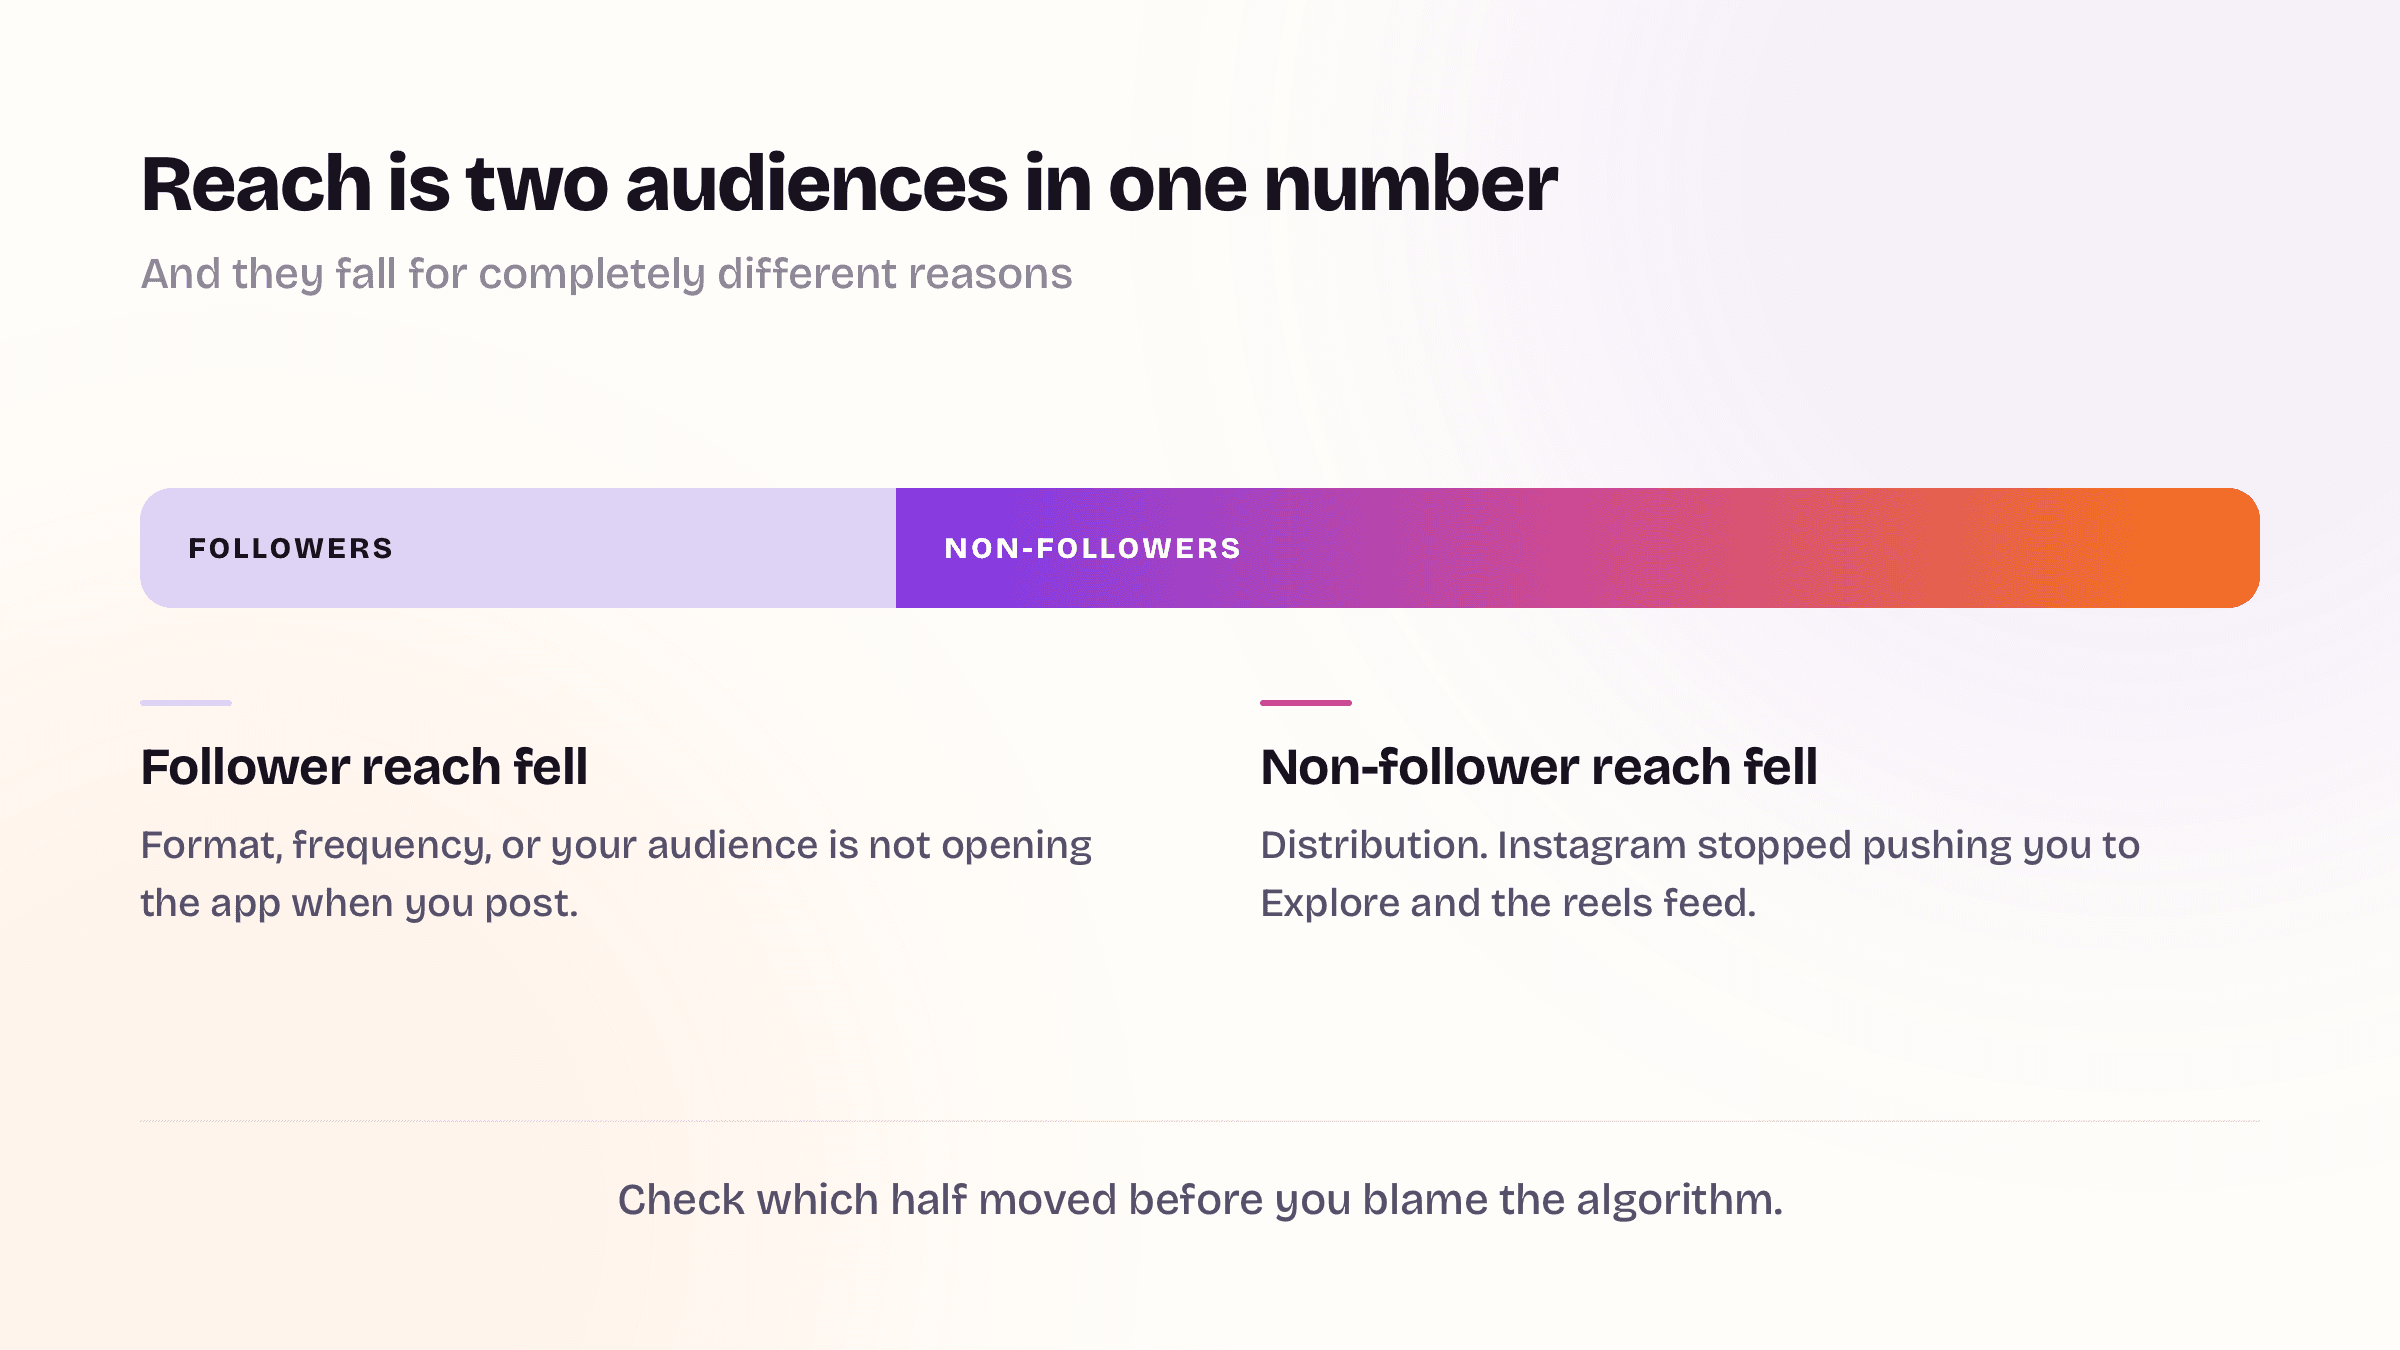
Follower reach fell. Your existing audience is seeing you less. The usual suspects, in order of likelihood: you posted at different times than usual (your audience has habits, and posting into their dead hours costs you the early engagement that everything else depends on), your cadence slipped or spiked (gaps teach the feed to deprioritise you, sudden bursts split your engagement across posts), or you leaned on a format your audience is quietly tired of.
Discovery reach fell. Strangers stopped finding you. Discovery is a tournament: your post competes in the first hours after publishing, and what it competes on is the engagement it earns from the people who saw it early. A run of posts your core audience liked but nobody passed on gives the ranking system little reason to widen the circle. Discovery dries up a post or two later, which is why the drop feels delayed and mysterious.
One thing worth being precise about, because the internet is not. Adam Mosseri has said that "like rates matter more for your followers, and send rates matter more for those who don't follow you." That is the comparison he actually made, and it is narrower than the versions you will read elsewhere. It does not mean sends outrank watch time, and no published Meta number tells you what any signal is worth. Anybody quoting you a multiplier is quoting a number that does not exist.
The boring causes, and how often they are the answer
Work down this table before you touch your content strategy. The top rows are the ones that actually explain most drops.
| What happened | How to check it in five minutes | What it looks like | |---|---|---| | The data has not settled | Re-read the same post in two days | Recent posts look bad, older ones look normal | | You posted less | Count posts this month vs your best month | Total reach fell but per-post reach held | | A viral outlier moved your baseline | Compare medians, not averages | One huge post last month, "collapse" this month | | Your format mix changed | Sort last 20 posts by format | Reel-heavy month followed by a carousel-heavy one | | Your posting windows drifted | Check publish times against your strong weeks | Follower reach fell, discovery held | | Seasonality | Compare to the same month last year | The dip repeats annually, if you kept the records |
Notice how many of these need a comparison against your own past, and how few need an opinion about the algorithm.
Two more worth naming, because they are real and people miss them. Instagram's recommendations guidelines call out "long captions unrelated to the underlying content" as low-quality publishing, so caption length alone is fine and caption length that has nothing to do with the post is not. The same page names "unoriginal content that is largely repurposed from another source with only minor, immaterial edits" which is the actual, qualitative rule underneath every unsourced repost-penalty number going around. We read that policy end to end in does reposting hurt your Instagram reach, and it contains no numbers at all.
Run the honest experiment
Pick your two best historical posting windows and your strongest format. Post consistently in those windows for two weeks, at the cadence of your best month. If reach recovers, it was never the algorithm, it was drift. If it does not, look at the early engagement your posts are earning, because reach follows engagement far more often than the reverse. Chasing reach directly is chasing the scoreboard instead of the game.
Questions people actually search 🔎
Why did my Instagram reach suddenly drop? Most often one of four things: the numbers have not settled yet (Meta documents up to a 48 hour delay), you posted less than usual, you are comparing against a month that contained an outlier, or your posting times drifted. Check those four before considering anything about the algorithm. A genuine ranking change would not hit one account in isolation.
Instagram reach dropped but engagement is the same. What does that mean? That pattern points at discovery rather than your followers. The people who already follow you are still responding normally, so the audience that shrank is the one that was finding you cold. Look at reach by non-followers across your last ten posts and compare it to a stronger month.
Did I get shadowbanned? There is no setting called that, but the thing people mean by it is real, documented, and you can go and look at it right now. Instagram's help centre says that if you use a professional account "you can see if your content may be eligible to be recommended in Account Status," and that being eligible "means Instagram may recommend your account or content on Reels, Feed, Explore, Search or Suggested Accounts to people who don't follow you."
The sentence that matters most for diagnosing a reach drop is this one: "Even if you're not eligible to be recommended, your content can still show up for your followers." That is the follower-versus-discovery split from earlier in this post, described by Instagram in its own words. If eligibility is the problem, discovery reach collapses while follower reach carries on looking normal. Since August 31 2026 there is one more way to lose that eligibility: Meta says an unlabelled profile featuring an AI-generated person "may see limits to their profile's reach", which is a profile-level restriction and not a post-level one. It does not apply to creators who merely use AI tools, and the difference is covered in what actually triggers an Instagram AI label.
To check it, open your profile, tap the menu in the top right, and find Account Status under "More info and support." Ignore any guide that tells you to go to Settings then Account, which is an older path. Two honest caveats from the same page: eligibility "doesn't guarantee that your content will be recommended," and these rules apply only to public accounts and only to people who do not already follow you.
How long does a reach drop last? There is no published figure, and anyone giving you one is inventing it. What you can control is the diagnosis: if the cause was cadence or timing, recovery tracks your return to that pattern. If it was a single weak run of posts, the next posts are judged on their own.
Does deleting and reposting fix it? No, and it costs you whatever engagement the original had accumulated. Instagram's own guidance points to the repost function rather than re-uploading, and re-uploading a post that already ran is the "unoriginal content" case, not a reset button.
The measurement problem underneath all of this
Every step above assumes you can compare this month to your stronger months, split by follower vs discovery, by format, by posting window. Instagram makes that hard, and in one specific way that surprises people.
There are two clocks on your numbers. An individual reel's insights stay available for up to two years after it was published. But your account-level history, the reach and profile-view trend that describes you rather than one post, is kept for 90 days. Meta's documentation states that "User Metrics data is stored for up to 90 days." So the per-post numbers feel permanent while the trend line quietly expires, which is exactly the ninety-day problem that makes seasonal comparison impossible.
Most creators diagnosing a reach drop are comparing against their memory of last month. That is how "the algorithm hates me" theories are born.
That is the gap Junibloom closes. It takes a daily snapshot of your official numbers and keeps all of them, then runs this diagnosis for you: the growth funnel splits discovery reach from follower reach and shows which one moved, the post map separates keepers from one-offs by format, and follower flow shows whether the drop cost you followers or only impressions. When reach falls you get the which and the why instead of a feeling. Doors open soon.
A 10-minute checklist for this week
- Wait 48 hours after posting before you judge any number.
- Split your last 10 posts: follower reach vs discovery reach. Which side fell?
- Compare medians against your best recent month, same formats against same formats.
- Write down your top two posting windows from that strong month. Are you still using them?
- Track saves and shares per 1,000 reached across your last 10 posts. Not because any public number tells you what they are worth, but because the ratio is a stable measure of whether the content is worth passing on, and it moves before reach does. We broke down which denominator to use in the engagement-rate guide.
- Start recording your numbers weekly. Future you, diagnosing the next dip, will need today as the baseline.
The one-line takeaway
Reach drops are a diagnosis, not a mood: give the data two days to settle, split followers from discovery, check the boring causes first, and keep the history that makes the comparison possible.